Gather data
Record video
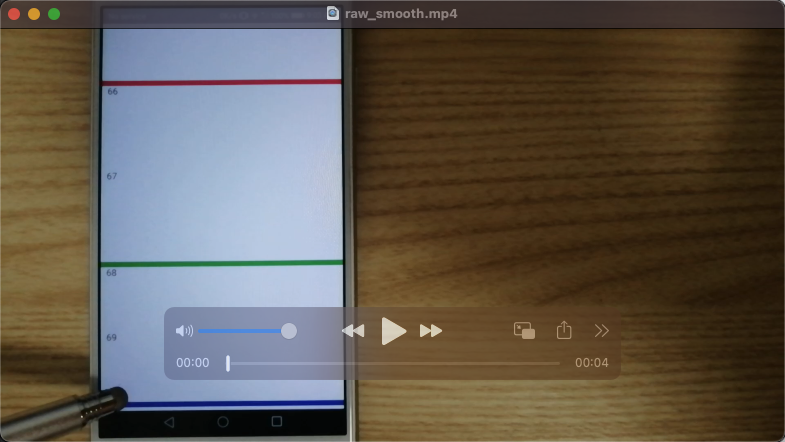
To get most real results, I use the camera of a second phone to record a video of the testing device. For example:
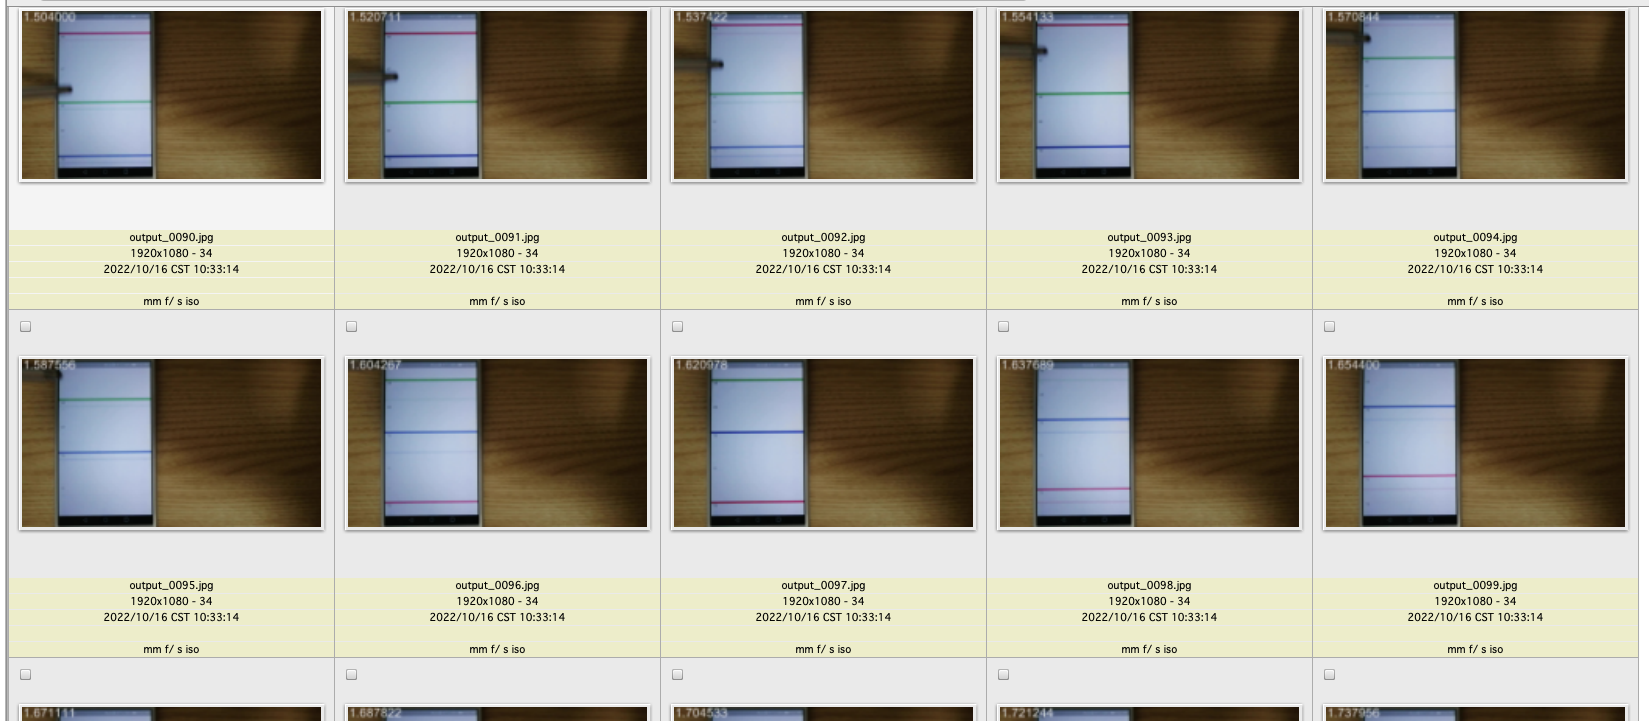
After getting a video (e.g. .mp4), the following commands can be utilized to break it into frames. Each frame will become a photo (.jpg), and a timestamp extracted from the video intrinsitc information is added to the left-top corner of the extracted frame.
ffmpeg -i path/to/your/video.mp4 -vsync 0 -frame_pts true -vf drawtext=fontfile=/usr/share/fonts/truetype/freefont/FreeMonoBold.ttf:fontsize=80:text='%{pts}':fontcolor=white@0.8:x=7:y=7 ~/temp/video_frames/output_%04d.jpg
(The video_to_frame.py does the same job as the command above.)
For example, (part of) the result is as follows. We will mainly analyze the parts of the video from pointer-down to scroll-end later.
Why use a second camera: If we use screen recording on the testing device, it can bias the result because the recording itself takes CPU and GPU. Moreover, the recorded screen may not be equivalent to what a user really percepts by eyes.
When debugging raw videos, it may be helpful to add some small headers that change its content to a great extent in every frame, such as this one. With that, we can easily spot, for example, whether there is really a jank (when the debug header is unchanged in two sibling video frames) or a bug in scrolling logic (when the header changes in two sibling frames but the ListView content is not shifted).
Record timeline tracing
I also record the timeline tracing data, which provide rich insights.
- Run with endless tracing buffer, i.e. with
--endless-trace-bufferflag. For example,flutter run --profile --endless-trace-buffer. - Perform all interactions with the app.
- Tap
vin the shell to open DevTool. - Tap download in DevTool panel to get somthing like
dart_devtools_2022-10-16_09_54_55.141.json. - Run
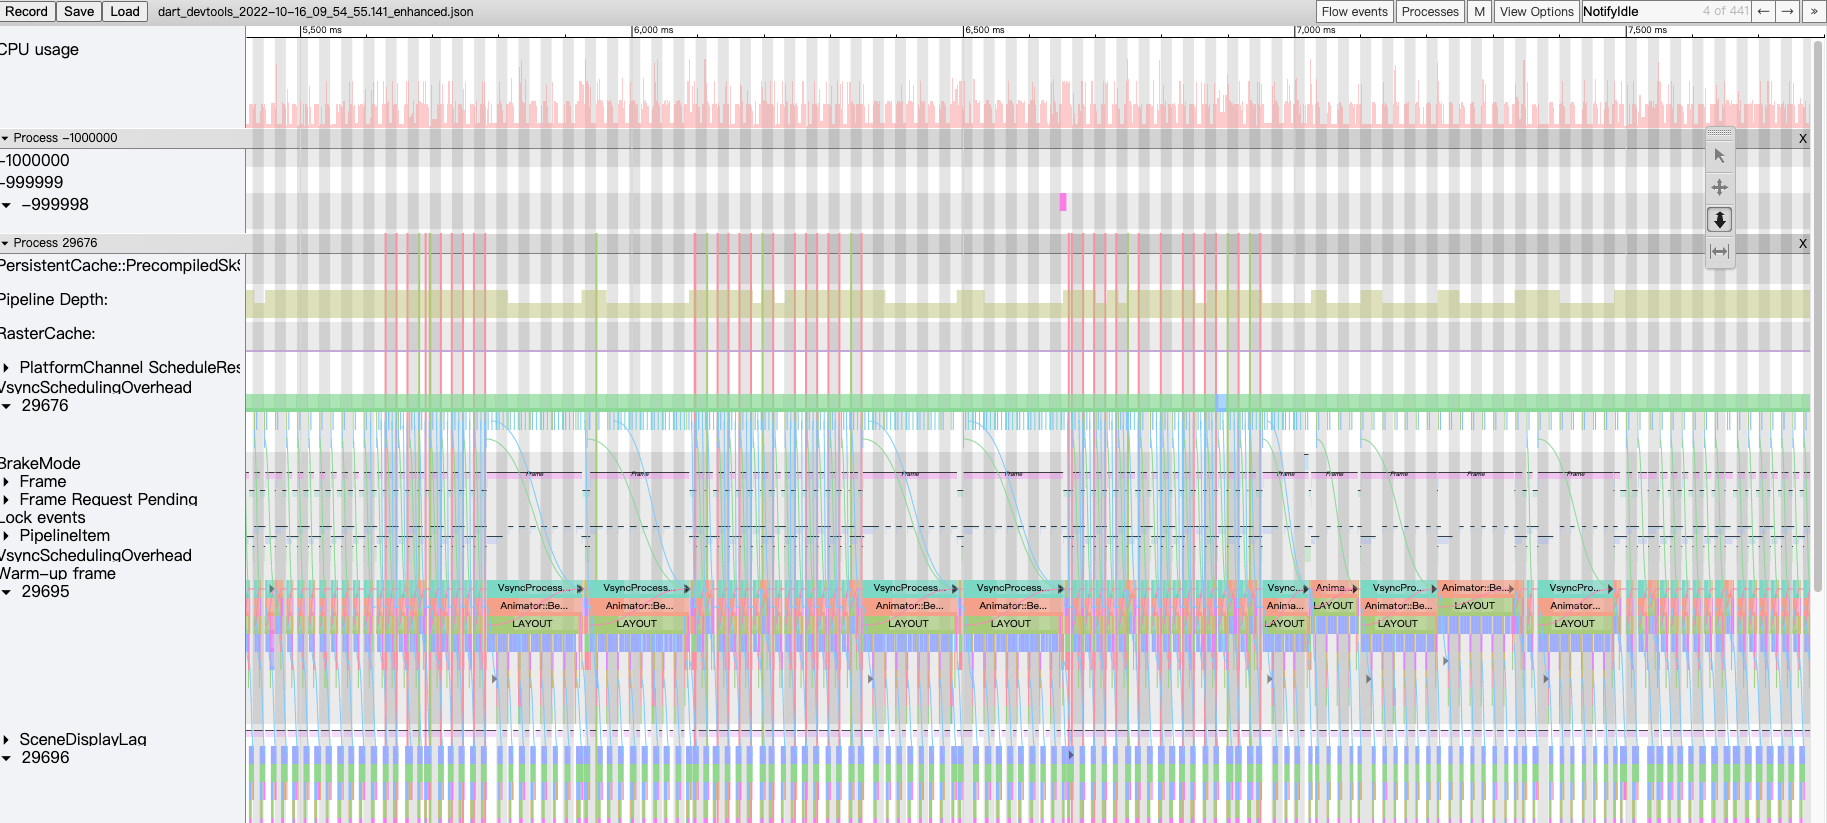
scripts/timeline/enhance.py, which synthesizes some "fake" events such as "Jank", so that we can easily spot them in the timeline. - The file can be opened in
chrome://tracing.
We will use automatic scripts later to enhance it.
Must perform all interactions before (not after) opening DevTool. Empirically, I observe large performance drop after DevTool is opened.
Sample result: