Result from tracing
By using the visualize_scroll.py script, we see the following figure. Shortly speaking, the blue curve is the time-vs-offset, and the orange curve is the time-vs-delta-offset, i.e. time-vs-velocity.
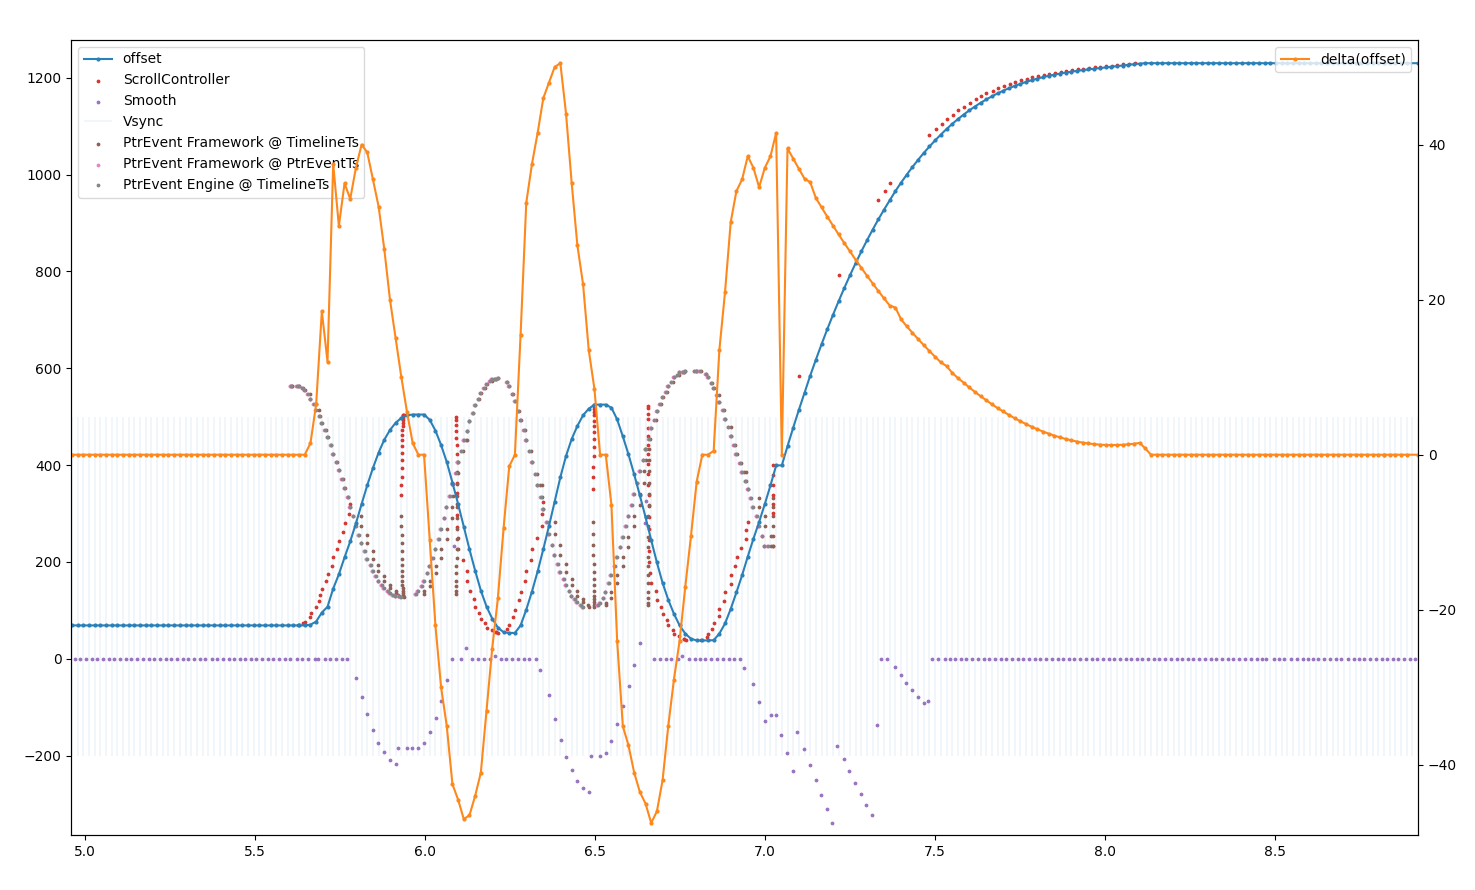
There are a few interesting results from it:
- At ~7.1s, The velocity suddenly becomes zero for one frame, when the user releases the finger (i.e.
PointerUpEvent). This is a bug of Flutter: https://github.com/flutter/flutter/issues/113494 - At ~8.2s, there is an abrupt velocity change. This is also a bug of Flutter: https://github.com/flutter/flutter/issues/113424.
- At 5.5-7.1s, the time-vs-velocity curve is not very smooth. This is because it is purely driven by human touch events, where it is just impossible to be very smooth. On the contrary, looking at the curve driven by ballistic
Simulationin 7.1s-8.2s, it is smooth.
Except for those points (which are not problem of this library), the curve satisfies the linearity definition well without the need of explanations.